1panel搭建哪吒监控v1
1panel搭建哪吒监控v1
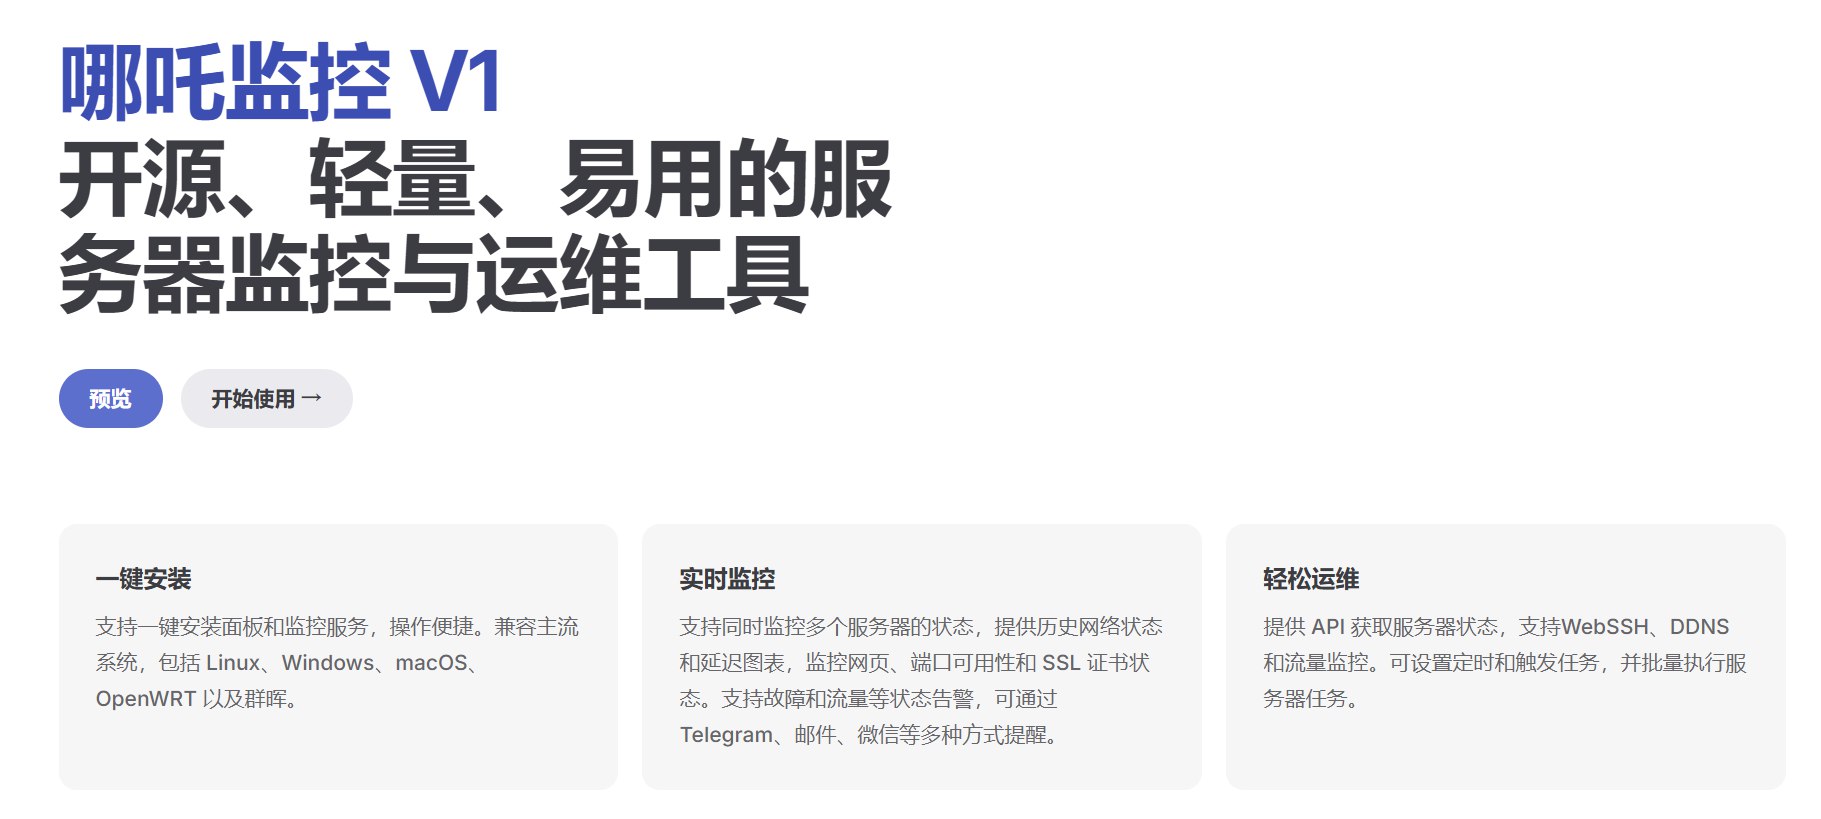
空白什么是 哪吒探针?
哪吒探针(Nezha Monitoring)是一个开源的服务器监控和运维工具,主要用于Linux系统的监控。它的主要特点和功能包括:
- 轻量级设计 - 资源占用极低
- 分布式架构 - 由服务端(Dashboard)和客户端(Agent)组成
- 实时监控 - 可监控服务器的CPU、内存、磁盘、网络等资源使用情况
- 多服务器管理 - 可同时监控多台服务器
- 美观的仪表盘 - 提供直观的Web界面展示监控数据
- 告警通知 - 支持异常情况的通知推送(如Telegram、企业微信等)
- 服务监控 - 支持对服务进程的在线状态监控
- 开源免费 - 基于MIT协议开源
1panel面板配置哪吒v1面板教程
1. Cloudflare设置
- 设置域名指向你部署哪吒v1服务器的ip,并打开小云朵
- 左侧—网络设置中启用gRPC和WebSockets
- 左侧-SSL/TLS设置为”完全”或”完全严格”
- 左侧-SSL/TLS-源服务器可选择申请15年证书(记得保存好生成的公钥私钥)
2. 面板机搭建
推荐配置:1c1g的稳定大厂机器
升级系统
1 | apt update -y && apt install wget curl sudo unzip git -y |
安装1panel面板
1 | # ubuntu系统 |
安装Docker
1 | curl -fsSL https://get.docker.com | bash -s docker |
3. 安装哪吒面板
安装Dashboard
国外服务器:
1 | curl -L https://raw.githubusercontent.com/nezhahq/scripts/refs/heads/main/install.sh -o nezha.sh && chmod +x nezha.sh && sudo ./nezha.sh |
国内服务器:
1 | curl -L https://gitee.com/naibahq/scripts/raw/main/install.sh -o nezha.sh && chmod +x nezha.sh && sudo CN=true ./nezha.sh |
安装过程中需要输入的信息:
- 站点标题: 自定义
- 暴露端口: 建议回车使用默认8008
- Agent连接地址: 设置为
dashboard.demo.com:443(你的域名:443) - 是否通过TLS连接agent: 选择
y - 指定后台语言: 按需
安装完成后,可以通过 服务器IP:8008 访问测试
4. 1panel面板设置
使用服务器ip:端口的形式登陆1panel,进入应用商店,安装OpenResty
左侧网站-证书添加你创建的15年证书(或使用acme申请),然后左侧设置-安全,开启面板ssl(后续可反向代理使用域名登录1panel,请自行上网搜索)
左侧网站-创建-反向代理,填入cloudflare解析好用于哪吒面板的域名,创建一个反向代理
添加上游配置
- 反向代理创建成功,右侧点击配置进入,点击配置文件
- 打开网站配置文件
在已有配置文件下面添加:1
2
3
4upstream dashboard {
keepalive 512;
server 127.0.0.1:8008;
}
添加反向代理
- 点击反向代理,添加反向代理,目标为
127.0.0.1:8008,保存 - 点击添加的反向代理-源文
- 将内容全选删除,替换为以下代码(如自定义了端口,请修改8008为对应端口):
1 | location ^~ / { |
- 开启https
点击HTTPS,选择添加或申请的证书,开启https
5. 哪吒面板设置
完成上述配置后,您可以通过域名访问面板。(默认用户名和密码是admin)
面板初始设置
- 修改用户名登录密码(重要)
- 左上头像-个人信息-更新个人信息
- 在系统设置中,真实IP请求头填写:
CF-Connecting-IP(以确保后台登录IP及其它功能正常显示真实IP)
添加服务监控
- 系统设置-服务,可添加以下测试服务进行监控:
- 上海电信:
sh.telecom.818198.xyz:80 - 上海移动:
sh.mobile.818198.xyz:80 - 广东移动:
gz.mobile.818198.xyz:80 - 广州电信:
gz.telecom.818198.xyz:80
[up主专用,视频内嵌代码贴在这]